


We use cookies on this site to enhance your experience.
By selecting “Accept” and continuing to use this website, you consent to the use of cookies.
The 2018/19 operating budget detailed information is presented beginning with a summary of the operating budget.
| Revenue | 2017/18 Budget |
2018/19 Budget |
Change | % Change |
|---|---|---|---|---|
| Tuition fees | 157,417 | 175,680 | 18,263 | 11.6% |
| Enrolment based government grants | 98,655 | 100,319 | 1,664 | 1.7% |
| Other income and fees | 24,528 | 24,538 | 10 | 0.0% |
| Revenue Total | 280,599 | 300,537 | 19,937 | 7.1% |
| Salary and Benefit Expenses |
2017/18 Budget |
2018/19 Budget |
Change | % Change |
| Full-/part-time faculty costs | 101,206 | 103,200 | 1,994 | 2% |
| Full-/part-time staff costs | 69,326 | 73,367 | 4,041 | 6% |
| Statutory and fringe benefits | 17,807 | 19,099 | 1,292 | 7% |
| Current service costs | 18,028 | 18,028 | N/A | 0% |
| Pension plan deficiency | 5,784 | 6,275 | 491 | 8% |
| Retirees, maternity, tuition exemptions |
4,875 | 5,073 | 198 | 4% |
| Post employment – non cash | N/A | N/A | N/A | N/A |
| Salary and Benefit Expenses Total |
217,026 | 225,041 | 8,015 | 4% |
| Non-Salary Expenses |
2017/18 Budget |
2018/19 Budget |
Change | % Change |
| Equipment/software | 4,071 | 4,695 | 624 | 15% |
| Library acquisitions | 3,871 | 3,858 | (13) | (0%) |
| Scholarships and bursaries | 16,975 | 18,203 | 1,228 | 7% |
| Travel expenses | 2,521 | 2,311 | (210) | (8%) |
| Facility rentals/occupancy costs | 2,313 | 2,429 | 116 | 5% |
| Supplies and general expense | 14,885 | 20,411 | 5,526 | 37% |
| Debt service | 5,373 | 5,373 | N/A | 0% |
| Capital and deferred maintenance | 5,774 | 5,457 | (317) | (5%) |
| Equipment/operating renewal | 3,063 | 3,607 | 544 | 18% |
| Utilities, insurance and taxes | 6,604 | 6,589 | (15) | (0%) |
| Contingency | 3,000 | 3,000 | N/A | 0% |
| Institutional reserve | 0 | 50 | 50 | N/A |
| Non-Salary Expenses Total |
68,450 | 78,984 | 7,534 | 11% |
| Expenses Total | 285,476 | 301,025 | 15,549 | 5% |
| (Deficit)/Surplus Before Budget Balancing |
(4,877) | (488) | 4,388 | N/A |
The summary is broken out into major revenue and expense types with a comparison to the 2017/18 budget noting the major changes year-over-year. Further, the impact of the strategic investment process is highlighted separately.
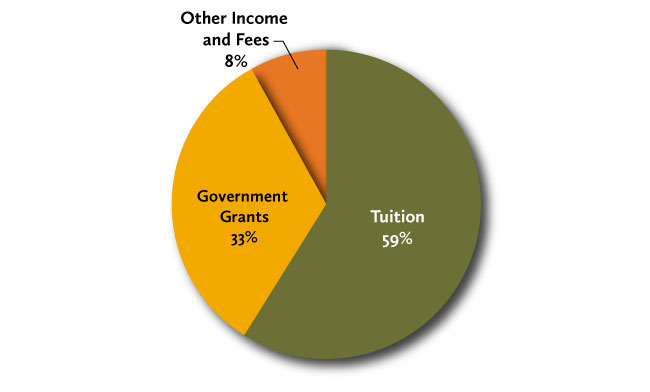
Revenues from student tuition fees and government operating grants account for 92% of the total operating revenues. The following chart depicts the breakdown of total revenue: other income and fees (8%), government grants (33%), and tuition (59%).
Overall, total revenues are expected to increase by $19.9 million or 7.1%. The following provides a comprehensive review of each major component of operating revenues and the factors causing the change from the previous year. For tuition fees, both enrolment growth and higher fee rates contribute to the revenue increase. For enrolment based grants, an increase in graduate spaces funded by MAESD through the SMA2 negotiation accounts for all of the revenue increase.
| Budget Components | 2017/18 | 2018/19 | Change | % |
|---|---|---|---|---|
| Tuition fees | 157,417 | 175,682 | 18,263 | 11.6% |
| Enrolment-based grants | 98,655 | 100,319 | 1,664 | 1.7% |
| Subtotal | 256,072 | 275,999 | 19,927 | 7.8% |
| Other revenue | 24,527 | 24,538 | 11 | 0.0% |
| Total | 280,599 | 300,537 | 19,938 | 7.1% |
| Student FTE | 17,992 | 19,008 | 1,016 | 5.6% |
Publicly funded tuition fees are governed by the Provincial government’s regulated framework of tuition fee policies and guidelines. The previous extension of the existing framework remains in place for academic years 2017/18 and 2018/19.
Under the Tuition Fee Framework for 2018/19, the overall average rate of tuition fee increase across all publicly funded programs at an institution continues to be capped at 3.0%. The maximum allowable annual tuition fee increase by program type is as follows:
Fees for international students are not eligible for MAESD operating grant funding and therefore, are not governed by the government’s tuition framework.
Generally speaking, tuition rates for international students had previously been guided by the tuition rate increases experienced by domestic students; that is, a complex matrix of fee rates based on continuing/entering and year of entry. In 2013/14 the Board of Governors approved a standard international tuition rate to be applied effective 2013/14 for entering students and the differentiated rate model to be phased out.
For other non-publicly-funded programs and courses, the University has full discretion over tuition fee increases because these are not eligible for provincial government funding and are not governed by the government’s tuition policy. Tuition rates for these programs are guided by the market and Laurier’s relative competiveness.
The following table shows the major components of the changes in tuition revenue for 2018/19 over 2017/18.
| Budget Components | 2017/18 | 2018/19 | Change | % |
|---|---|---|---|---|
| Undergraduate | 137,992 | 154,290 | 16,298 | 11.8% |
| Graduate | 18,500 | 20,590 | 2,090 | 11.3% |
| Cross-Registration | 925 | 800 | -125 | -13.5% |
| Total | 157,417 | 175,680 | 18,263 | 11.6% |
Cross-registration fees relate to students who are cross-registered with both Laurier and the University of Waterloo. Revenue flows between the two institutions and represents an allocation for both tuition and grant.
Total UG tuition revenue is forecasted to increase by 11.8% with fees for grant-eligible and grant-ineligible students forecasted to increase by 8.4% and 27.5% respectively. The 8.4% UG increase can be further broken down by 3.5% rate and 4.5% volume for grant-eligible students and 5.3% rate and 20.3% volume for grant-ineligible students.
Graduate tuition revenue is forecasted to increase by 11.3% overall with fees for students in grant-eligible and grant-ineligible programs forecast to increase by 10.0% and 15.1%, respectively.
MAESD implemented a new funding formula to allocate operating grant revenue in fiscal 2017/18, aligned with the beginning of SMA2. Operating grant allocations for universities are now governed by a corridor system that includes a negotiated midpoint, indicating the level of funded student enrolments.
The operating grant mechanism implemented by MAESD in fiscal 2017/18 has three major components:
The following table outlines the major sources of government grant funding in fiscal 2018/19.
| Source of Funding | 2017/18 | 2018/19 | Change | % Change |
|---|---|---|---|---|
| Core operating grant | 93,781 | 95,520 | 1,739 | 1.9% |
| Differentiation envelope | 5,659 | 5,659 | 0 | 1.1% |
| International student recovery | -785 | -860 | -75 | 9.6% |
| Total | 98,655 | 100,319 | 1,664 | 1.7% |
Laurier’s RCM budget model allocates revenue based on student activity. A base domestic tuition rate is allocated based on the Faculty teaching each course. Operating grant and any tuition premium over and above the base rate is allocated based on students’ Faculty of Registration for their program. The total revenue for each Faculty is broken down as follows.
| Faculty |
2017/18 Revenue |
2018/19 Revenue (Forecast) |
Change | % Change |
|---|---|---|---|---|
| Arts | 61.5 | 62.9 | 1.4 | 2.3% |
| Lazaridis School | 84.0 | 89.1 | 5.1 | 6.1% |
| Education | 2.6 | 3.2 | 0.6 | 23.1% |
| FHSS | 15.2 | 17.5 | 2.3 | 15.1% |
| Liberal Arts | 12.7 | 14.1 | 1.4 | 11.0% |
| Music | 7.3 | 7.6 | 0.3 | 4.1% |
| SIPG | 1.1 | 1.3 | 0.2 | 18.2% |
| Science | 63.0 | 69.6 | 6.6 | 10.5% |
| Social Work | 9.4 | 10.7 | 1.3 | 13.8% |
| Total | 256.9 | 276.0 | 19.2 | 7.5% |
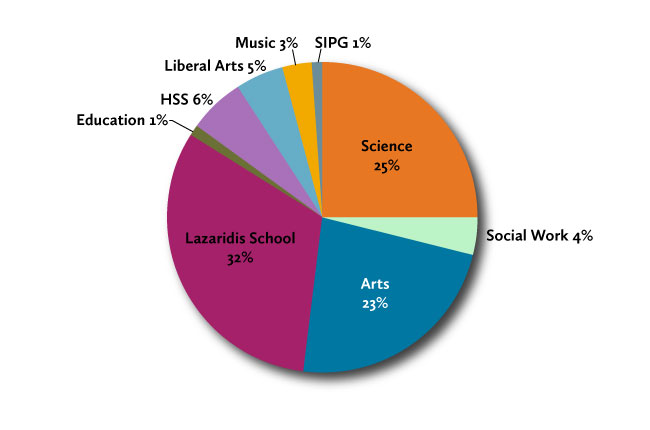
The following chart outlines the total revenue allocation by faculty: Arts (23%), Lazaridis School (32%), Education (1%), HSS (6%), Liberal Arts (5%), Music 3%, SIPG (1%), Science (25%), Social Work (4%).
Other income and fees are expected to remain consistent from the prior year. This category includes other general fees and program revenues such as transcript fees, co-op/internship fees, application fees, athletics, financing income, student interest, and teaching support services. Changes in these budget items can fluctuate, by their nature, but many changes are due to adjusting the budget to previous year’s actual experience. Also included in other revenue is the Bookstore contribution to the Operating Budget.
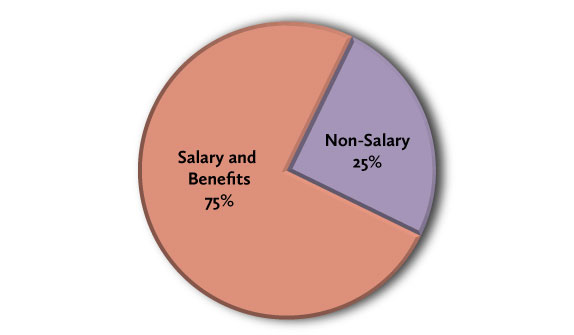
The key drivers that impact salary rate expenditures are government policy regarding executive compensation and regular negotiated settlements through the collective bargaining process. The financial obligations with respect to the financing of Laurier’s Pension Plan require going concern deficiency payments and annual current service costs. Expenditures are also impacted by investments that are needed to support strategic investments, inflationary costs, regulatory requirements and other growth and quality requirements. Overall, total expenses are expected to increase by $15.5 million or 5%. Faculty and staff salaries and employee benefits account for 75% of the total operating expenditures. The following chart depicts the breakdown of total expenses: salary and benefits (75%) and non-salary (25%).
Direct teaching costs results from the creation of new programs and the related new program budgets are reviewed and approved by Senate Finance and Finance.
| Description | Base | OTO | Total |
|---|---|---|---|
| Policing – Keypath partner | 400,000 | N/A | 400,000 |
| Game Design – Conestoga partner | N/A | 189,507 | 189,507 |
| Master of Public Safety (MPS) – Tenure track faculty | 114,950 | N/A | 114,950 |
| Policing/MPS – Academic program assistant | 27,945 | N/A | 27,945 |
| Total | 542,895 | 189,507 | 732,402 |
| Description | Base | OTO | Total |
|---|---|---|---|
| Master of Social Work (online) – Program coordinator | N/A | 72,600 | 72,600 |
| Master of Social Work (online) – Keypath partner | 218,000 | N/A | 218,000 |
| Total | 218,000 | 72,600 | 290,600 |
| Description | Base | OTO | Total |
|---|---|---|---|
| Digital Media and Journalism | 268,000 | N/A | 268,000 |
| Total | 268,000 | N/A | 268,000 |
| Description | Base | OTO | Total |
|---|---|---|---|
| Faculty of Science – Academic advisor | 82,414 | N/A | 84,414 |
| Total | 84,414 | N/A | 84,414 |
| Description | Base | OTO | Total |
|---|---|---|---|
| Masters of Education (Student Affairs focus) – Limited-term faculty | N/A | 33,820 | 33,820 |
| Masters of Education (Student Affairs focus) – Program coordinator | N/A | 16,970 | 16,970 |
| Total | N/A | 50,790 | 50,790 |
The grand total of all areas combined based on the above tables are:
The table below lists the Departmental Requests that met the guidelines and were, therefore, recommended by the Budget Committee for approval in 2018/19.
| Request | Base | OTO | Total | % |
|---|---|---|---|---|
| Recruitment initiatives | 191,000 | 540,000 | 731,000 | 16% |
| Development campaign | 712,981 | N/A | 712,981 | 16% |
| Student support/student service | 420,900 | 175,593 | 593,493 | 13% |
| Investments in technology | 303,625 | 246,532 | 550,157 | 12% |
| Indigenization initiative | N/A | 500,000 | 500,000 | 11% |
| Communications/Public Relations | 184,000 | 243,000 | 427,000 | 10% |
| Administrative support | 281,654 | 103,000 | 384,654 | 9% |
| Academic support | N/A | 282,893 | 282,893 | 6% |
| Research | 141,570 | N/A | 141,570 | 3% |
| Health and safety | N/A | 102,000 | 102,000 | 2% |
| Institutional initiatives | N/A | 45,000 | 45,000 | 1% |
| Total | 2,235,730 | 2,235,018 | 4,470,748 | 100% |
Institutional costs with unit oversight are costs that are directly attributed to a unit, and the unit has the responsibility to oversee the cost. However, the unit has limited control over how the cost may increase or decrease.
| Description | Base | OTO | Total |
|---|---|---|---|
| Investments in technology | 1,221,791 | N/A | 1,221,791 |
| Scholarships | 1,208,171 | N/A | 1,208,171 |
| Contractual obligations | 787,108 | 146,520 | 933,628 |
| Foreign exchange | N/A | 727,794 | 727,794 |
| Academic support | 158,305 | N/A | 158,305 |
| Total | 3,375,375 | 874,314 | 4,249,689 |
Institutional costs with central oversight are costs that cannot be directly attributed to any one unit. These costs are reviewed centrally for any changes that may cause the cost to increase or decrease.
| Revenue/Expense | Description | Base | OTO | Total |
|---|---|---|---|---|
| Revenue | Bank interest income | 205,000 | 0 | 205,500 |
| Revenue | Senior citizens tuition waivers | -50,000 | 0 | -50,000 |
| Revenue total | N/A | 155,000 | 0 | 155,000 |
| Expense | Central memberships | 240,000 | 0 | 240,000 |
| Expense | Special pension arrangements | 47,022 | 0 | 47,022 |
| Expense | Institutional reserve (insurance) | 50,000 | 0 | 50,000 |
| Expense | Institutional reserve (security) | 120,000 | 0 | 120,000 |
| Expense | 202 Regina renovation (post Schlegel/Peters move) | 0 | 1,500,000 | 1,500,000 |
| Expense | Contingency top-up* | 297,954 | 0 | 297,976 |
| Expense total | N/A | 754,976 | 1,500,000 | 2,254,976 |
| N/A | Grand total | 599,976 | 1,500,000 | 2,099,976 |
*To bring contingency back up to $3 million, which reflects a modest 1% of the University Budget.
As part of the RCM transition plan, for 2018/19, 15% of the surplus is returned to the Faculty. If the Faculty’s surplus is more than $3.0 million or 10% of revenue, the surplus is returned in base funds; otherwise it is returned in one-time only funds.
The below table outlines the 2018/19 Faculty surpluses and returned surplus (15%):
| Faculty |
Initial 2018/19 |
% of Revenue | Returned Surplus (15%) |
|---|---|---|---|
| Lazaridis | 6,140,016 | 6.76% | 921,002 |
| Education | 164,833 | 4.91% | 24,725 |
| HSS | 1,744,167 | 9.96% | 261,625 |
| Science | 5,568,699 | 7.94% | 835,305 |
| Total | 13,617,715 | N/A | 2,042,657 |
Faculties can use their returned surplus to supplement their planned 2018/19 direct costs, and in turn, advance their strategic priorities. The following table indicates the RCM transition details by cost category.
| Category | Description | Base | OTO | Total |
|---|---|---|---|---|
| Salary and benefit expenses | Full/part-time faculty costs | 206,000 | 248,036 | 454,036 |
| Salary and benefit expenses | Full/part-time staff costs | 584,720 | N/A | 584,720 |
| Salary and benefit expenses | Statutory and fringe benefits | 166,053 | 38,314 | 204,367 |
| Salary and benefit expenses total | N/A | 956,773 | 286,350 | 1,243,123 |
| Non-salary expenses | Scholarships and bursaries | 52,867 | N/A | 52,867 |
| Non-salary expenses | Supplies and general expense | 381,668 | N/A | 381,668 |
| Non-salary expenses | Travel expenses | 10,000 | N/A | 10,000 |
| Non-salary expenses | Capital and deferred maintenance | 200,000 | N/A | 200,000 |
| Non-salary expenses | Equipment/operating renewal | 155,000 | N/A | 155,000 |
| Non-salary expenses total | N/A | 799,535 | N/A | 799,535 |
| Returned surplus total | N/A | 1,756,308 | 286,350 | 2,042,658 |
| Less: targets | Full/part-time faculty costs | -390,058 | N/A | -390,058 |
| Less: targets | Statutory and fringe benefits | -81,912 | N/A | -81,912 |
| Less: targets total | N/A | -471,970 | N/A | -471,970 |
| RCM Transition | N/A | 1,284,338 | 286,350 | 1,570,688 |
This section will provide detailed commentary to the 2018/19 Budget including review of the major drivers influencing the expenditure assumptions. Further, it provides explanation and highlights the major variances to expenditures as noted in the Operating Budget table for 2018/19 as compared to the 2017/18 Budget.
The following provides a comprehensive review of each major component of University Operating Budget expenses and the factors increasing and decreasing over the previous year that result in this overall increase.
Salaries and benefits for faculty and staff (full- and part-time) make up the largest portion of the University’s operating expenditure budget ($225 million or 75%).
The total faculty and staff salaries and benefits budget is comprised of the many salary groups. The following information depicts the composition of the labour and salary groups making up the total salary costs.
The salary and benefit assumptions continue to reflect that increases will continue, as per previous years’ experience. The salaries & benefits increases for 2018/19 over the previous year of $8,015,000, or 4%, is a result of the following major salary and benefit related budget components:
Compensation increases driven by collective agreements are the largest cost driver of this budget category. The following changes also contributed to the year-over-year change:
Increases from known and expected salary rate increases as per collective agreements are the largest cost driver of this budget category. The following changes also contributed to the year-over-year change:
This amount is based on the current and projected increase in the faculty and staff complement. This budget is estimated on an average percentage rate. Contributors to the increase also include the strategic investments that impacted faculty and staff positions.
The Current Service Cost is set by the Actuary based on the results of the Plan valuation and is intended to cover the cost of benefits earned by Pension Plan members for the coming year. The Current Service Cost is calculated as a percentage of pensionable salary.
In addition to Current Service Costs, the University must pay for any unfunded deficits that have occurred in the Plan. Pension Plan deficiencies are calculated by the Actuary at the time of the Plan’s formal Valuation, which, in Laurier’s case, was done as at April 30, 2017. There are two calculations, both reflecting the funded status of the Plan at a point in time. The Going Concern valuation provides an assessment of the Plan’s financial position at the valuation date on the premise the Plan continues into the future indefinitely. Based on the current funding framework, Going Concern Deficits must be amortized over a period not to exceed 15 years. Laurier’s Going Concern Deficit as at April 30, 2017 is $29.6 million. The Solvency valuation is intended to provide an assessment of the Plan’s financial position at the valuation date on the premise that certain obligations as prescribed by the act are settled on the valuation date for all members should the Plan wind up. The Actuary must comply with more restrictive assumptions and methodologies when performing this calculation. Laurier’s last Valuation showed a Solvency Deficit of $35.8 million.
Based on the actuarial calculations, the University made a special annual payment of $3.6 million in 2017/18 and is required to make payments of $6.3 million each year thereafter to fund the deficit.
Pension costs are escalating internationally and Canadian employers, including universities, are challenged to meet the true cost of providing these benefits. Laurier is no different and steps have been taken to mitigate the high cost escalation through Plan design changes such as increased contributions. The 2018/19 Budget contains provision of $6.3 million (2017/18: $5.8 million) in Going Concern Deficit special payments and Current Service Costs of $18.0 million (2017/18: $18.0 million).
The Special Pension Arrangement budget increased by $148,000 based on employees currently remaining in the program and $50,000 was added to maternity benefits based on actual experience.
This category, which includes a number of non-salary budgets, increased by $7.5 million year-over-year. The following explains the main cost category changes:
The largest change was an increase to ICT Hardware/Software maintenance of $708,000 (Institutional Cost-Unit) and $77,000 investment for the Banner Roadmap initiative. Foreign exchange resulted in a year-over-year increase to ICT software maintenance contracts of $52,000. Offsetting this overall increase is budget reallocations of approximately $200,000 to align with expected spend.
In the library, a significant portion of the E-resources and serials are acquired in US currency. Each year, the foreign exchange is reviewed and a corresponding adjustment is made. For 2018/19, the rate of $0.80 USD/$1.00 CAD was used versus $0.74 USD/$1.00 CAD in 2017/18. The improvement of the rate assumption accounts for $134,000 of the change year-over-year. Offsetting the improvement is an additional inflation adjustment of 5% on E-Resources accounting for $158,000.
An increase of $883,000 reflects the number of undergraduate students who qualified for a merit-based scholarship. There were no changes to the merit based scholarship grid. An additional $325,000 for graduate scholarships was added based on the forecasted increase in graduate enrolment for 2018/19.
This decrease is a result of aligning budget with expected spending.
Annual rent increases on leased properties for 255 King Street, 45 Lodge Street and Balsillie account for this increase. Planned consolidation of administrative space at 202 Regina will reduce reliance on external leased premises yielding future year savings of approximately $715,000 of base budget which can be repurposed.
This category includes a multitude of account categories across all units within the University and had a 37% change year-over-year. As part of the departmental request process, $1.5 million OTO was added most notably for recruitment marketing initiatives and Indigenization plan advancement, and Brantford-Laurier YMCA. An additional $732,000 was added as part of the Institutional Cost – Unit oversight process with the YMCA-Athletics being the largest contributor. The 202 Regina renovation at an anticipated cost of $1.5 million OTO will consolidate administrative space post-Schlegel and Peters buildings renovations. Lastly, incremental to last year is a $1.1 million investment in the Faculty-supported initiatives and programs relating to Keypath, Policing, Game Design and Master of Public Safety. Budget reallocations from other categories account for the small remaining balance.
The major change is the Faculty-led construction and renovation of $200,000 relating to Northdale and the installation of OneCard access for the Faculty of Science. Offsetting this increase is the completion of the 2017/18 OTO direct teaching cost of $400,000 that was incurred for the construction of a new teaching space in Brantford and other budget reallocations occurring throughout the year.
An increase of $514,000 resulted from the Institutional Cost – unit oversight process where it was determined additional funding was required for ICT Classroom technology and Infrastructure. The Faculty of Science estimates $155,000 of their returned surplus will be invested in their equipment renewal plans. Offsetting this increase in equipment renewal is reallocations to align with expected spend.
In 2017/18, an Insurance Office was established under the direction of the AVP: Campus Operations & Risk Management. The Insurance Office purchases all insurance and manages claims for the University, with the exception of employee benefit insurance and student benefit insurance. The small change in this category reflects reallocations of non-insurance costs to other cost categories. There was no change to utilities or taxes year-over-year.
Contingency is maintained at $3.0 million which reflects a modest 1% of the University Budget.
In 2018/19 an institutional reserve was set up for the annual premium cost of a Cyber Security insurance policy.
The following tables summarize the "expense only" Operating Budget by Faculty, Shared Service and Institutional – Central Oversight categories.
| Faculty |
Budget |
Budget 2018/19 |
Change | % Change |
|---|---|---|---|---|
| Faculty of Arts | 38,094 | 38,045 | -49 | -0.1% |
| Faculty of Education | 1,799 | 1,769 | -30 | -1.7% |
| Faculty of Human and Social Sciences | 6,986 | 8,409 | 1,423 | 20.4% |
| Faculty of Liberal Arts | 8,365 | 8,454 | 88 | 1.1% |
| Lazaridis School of Business and Economics | 41,560 | 44,733 | 3,173 | 7.6% |
| Faculty of Music | 8,068 | 8,001 | -67 | -0.8% |
| Faculty of Science | 31,670 | 33,599 | 1,929 | 6.1% |
| Faculty of Social Work | 7,870 | 8,239 | 369 | 4.7% |
| SIPG | 1,648 | 1,529 | -119 | -7.2% |
| Total Faculties (after RCM Transition) | 146,060 | 152,778 | 6,717 | 4.6% |
| Office | Shared Service | Budget 2017/18 |
Budget 2018/19 |
Change | % Change |
|---|---|---|---|---|---|
| President | Office of the President | 1,047 | 1,311 | 264 | 25.2% |
| President | Dispute Resolution | 277 | 179 | -98 | -35.3% |
| President | General Counsel | 786 | 892 | 106 | 13.5% |
| President | University Secretariat | 587 | 574 | -13 | -2.2% |
| President | Office of Indigenous Initiatives | 259 | 763 | 504 | 195.0% |
| President | President Office Total | 2,955 | 3,719 | 1,435 | 25.8% |
| Provost and VP: Academic | Centre for Teaching Innovation and Excellence | 2,404 | 2,333 | -71 | -3.0% |
| Provost and VP: Academic | Enrolment Services | 9,803 | 10,154 | 351 | 3.6% |
| Provost and VP: Academic | Faculty of Graduate and Postdoctoral Studies | 879 | 857 | -21 | -2.4% |
| Provost and VP: Academic | Global Engagement | 1,848 | 1,941 | 93 | 5.0% |
| Provost and VP: Academic | ICT | 11,562 | 13,221 | 1,659 | 14.4% |
| Provost and VP: Academic | Institutional Research | 833 | 948 | 115 | 13.8% |
| Provost and VP: Academic | Library | 11,494 | 11,096 | -398 | -3.5% |
| Provost and VP: Academic | Press | 915 | 918 | 2 | 0.3% |
| Provost and VP: Academic | Provost's Office / Faculty Relations | 10,089 | 10,039 | -50 | -0.5% |
| Provost and VP: Academic | Scholarships and Bursaries | 8,137 | 7,893 | -244 | -3.0% |
| Provost and VP: Academic | Provost and VP: Academic Office Total | 57,965 | 59,401 | 1,435 | 2.5% |
| VP: Finance and Administration | Financial Resources | 5,609 | 5,598 | -11 | -0.2% |
| VP: Finance and Administration | Human Resources and Employee Benefits | 9,436 | 9,842 | 406 | 4.3% |
| VP: Finance and Administration | Facilities and Asset Management | 21,752 | 22,005 | 253 | 1.2% |
| VP: Finance and Administration | Campus Operations and Risk Management | 5,088 | 6,382 | 1,294 | 25.4% |
| VP: Finance and Administration | Office of the VP Finance and Administration | 1,354 | 1,050 | -304 | -22.4% |
| VP: Finance and Administration | VP: Finance and Administration Office Total | 43,239 | 44,877 | 1,638 | 3.8% |
| SEO – Brantford | SEO's Office | 777 | 617 | -160 | -20.6% |
| SEO – Brantford | Communication, Public Affairs and Marketing | 3,334 | 3,780 | 446 | 13.4% |
| SEO – Brantford | Government Relations | 197 | 212 | 15 | 7.6% |
| SEO – Brantford | University Relations | 936 | 956 | 20 | 2.2% |
| SEO – Brantford | SEO – Brantford Office Total | 5,244 | 5,566 | 322 | 6.1% |
| VP – Development | Development and Alumni Affairs | 4,103 | 4,978 | 875 | 21.3% |
| VP – Development | VP – Development Total | 4,103 | 4,978 | 875 | 21.3% |
| VP – Research | Research | 2,313 | 2,364 | 51 | 2.2% |
| VP – Research | VP – Research Total | 2,313 | 2,364 | 51 | 2.2% |
| VP – Student Affairs | Athletics | 4,916 | 5,677 | 761 | 15.5% |
| VP – Student Affairs | Student Services | 12,340 | 13,542 | 1,202 | 9.7% |
| VP – Student Affairs | VP – Student Affairs Office Total | 17,255 | 19,219 | 1,963 | 11.4% |
| N/A | Total Shared Services | 133,074 | 140,122 | 7,048 | 5.3% |
| Totals | Budget 2017/18 |
Budget 2018/19 |
Change | % Change |
|---|---|---|---|---|
| Total faculties (after RCM transition) | 146,060 | 152,778 | 6,717 | 4.6% |
| Total shared services | 133,074 | 140,122 | 7,048 | 5.3% |
| Total institutional – central oversight | 12,598 | 13,320 | 721 | 5.7% |
| Less: Cost recoveries | -6,257 | -5,194 | -1,062 | N/A |
| Total expenses | 285,476 | 301,025 | 15,549 | 5.1% |
The following table summarizes the Faculty allocation under the RCM Budget model. Overall, Faculty bottom-line positions are ($7.2) million after the University Fund contribution of $22.0 million. The transition plan detail in its second year is shown below.
| Description | Arts | Lazaridis | Education | HSS | Liberal Arts |
Music | SIPG | Science | Social Work |
Total |
|---|---|---|---|---|---|---|---|---|---|---|
| Tuition and grant revenue | 62,898 | 89,061 | 3,207 | 17,493 | 14,150 | 7,557 | 1,265 | 69,617 | 10,751 | 275,999 |
| Non-tuition and grant revenue | 1,109 | 1,709 | 151 | 25 | 64 | 197 | 183 | 545 | 264 | 4,246 |
| Total revenue | 64,007 | 90,770 | 3,358 | 17,518 | 14,214 | 7,754 | 1,448 | 70,162 | 11,015 | 280,245 |
| Direct costs | 38,263 | 43,812 | 1,744 | 8,147 | 8,592 | 8,116 | 1,529 | 32,764 | 8,239 | 151,207 |
| Contribution margin | 25,744 | 46,958 | 1,613 | 9,371 | 5,622 | (363) | (81) | 37,398 | 2,776 | 129,039 |
| Shared service allocation | 27,855 | 33,693 | 1,192 | 6,227 | 6,600 | 4,989 | 1,935 | 26,260 | 5,373 | 114,124 |
| University fund revenue assessment (8%) |
5,032 | 7,125 | 257 | 1,399 | 1,132 | 605 | 101 | 5,569 | 860 | 22,080 |
| Bottom-line position | (7,143) | 6,140 | 165 | 1,744 | (2,110) | (5,956) | (2,117) | 5,569 | (3,457) | 7,165 |
| Transition Plan | Arts | Lazaridis | Education | HSS | Liberal Arts |
Music | SIPG | Science | Social Work |
Total |
| Initial surplus to university fund |
N/A | (6,140) | (165) | (1,744) | N/A | N/A | N/A | (5,569) | N/A | (13,618) |
| Returned surplus at 15% | N/A | 921 | 25 | 262 | N/A | N/A | N/A | 835 | N/A | 2,043 |
| Subvention funding | 6,924 | N/A | N/A | N/A | 1,971 | 5,841 | 2,117 | N/A | 3,457 | 20,311 |
| Budget target | 218 | N/A | N/A | N/A | 139 | 115 | N/A | N/A | N/A | 472 |
| Final faculty bottom-line positions |
(0) | 921 | 25 | 262 | (0) | (0) | 0 | 835 | 0 | 2,043 |
Note: School of International Policy and Governance (SIPG) full-time faculty costs are reflected in the direct costs of the cross-appointed Faculty (Arts = $1.2 million; Lazaridis School = $0.46 million).
The following chart shows both the contribution margin and bottom line position of each of the Faculties. With the exception of Music and SIPG, all of the Faculties are able to cover their direct costs.
Shared Services include both the departmental revenue (e.g. Comprehensive Student Service Fee) and costs of administrative units (e.g. salaries, operating costs) as well as the costs for the Institutional-level supports each oversees (Institutional costs – Unit oversight).
Shared Services are grouped into cost pools. Shared Services within the same cost pool generally have a similar cost driver. A cost driver is a countable unit whose increase or decrease can lead to a change in costs (e.g. the cost of Student Services can be linked to the number of students).
A complete listing of the administrative units included in each cost pool and the associated cost driver information can be found in Appendix II: Cost Driver Detailed Information.
| Cost Pool | Departmental | Institutional: Unit Oversight |
Grand Total |
|---|---|---|---|
| Central Support Services | 22,125,637 | 1,338,340 | 24,463,977 |
| Development and Alumni | 3,878,556 | - | 3,878,556 |
| Faculty, Staff and Student Services | 20,258,104 | 16,646,082 | 36,904,186 |
| Occupancy | 16,002,364 | 9,212,873 | 25,215,237 |
| Research Support | 1,300,545 | - | 1,300,545 |
| Scholarships and Bursaries | 197,477 | 7,531,289 | 7,728,766 |
| Student Support | 15,632,866 | - | 15,632,866 |
| Grand Total | 79,395,549 | 34,728,584 | 114,124,133 |
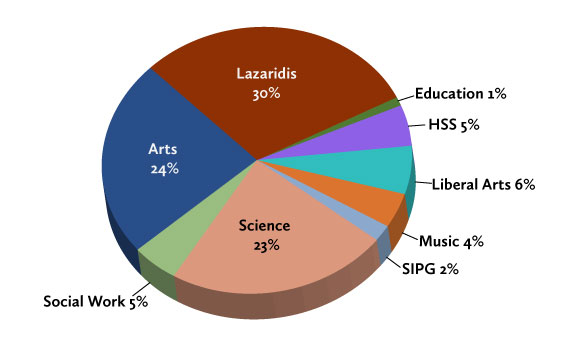
The chart below illustrates the shared service allocation by Faculty using the cost driver methodology: Science (23%), Social Work (5%), Arts (24%), Lazaridis (30%), Education (1%), HSS (5%), Liberal Arts (6%), Music (4%), and SIPG (2%).
The transition plan outlines how, over a five year period, Faculties will transition from their historical budget allocation to an RCM allocation informed by their revenue. In particular, the transition plan outlines how Faculty surpluses and subventions will be administered over the five years. Conceptually, the increase in the amount of surplus returned to Faculties each year is offset by a reduction in subvention. The University Fund Contribution percentage was modelled by taking into consideration that over five years some Faculties, while moving closer to a balanced position, may need to be considered for a more permanent subvention. The University Fund Contribution is reviewed by the Budget Committee annually.
A positive bottom line position indicates a Faculty surplus. A positive bottom line position occurs when the revenue from tuition, grant and other sources exceeds a Faculty’s direct costs, University Fund contribution and shared service allocation. Initially all Faculty surpluses are returned to the University Fund.
For 2018/19, 15% of the surplus is returned to the Faculty. This percentage is intended to increase each of the five years indicated in Figure 2: Proposed Surplus Holdback Schedule. If the Faculty’s surplus is more than $3.0 million or 10% of revenue, the surplus is returned in base funds; otherwise it is returned in one-time-only funds.
A negative bottom line position indicates a Faculty deficit. A negative bottom line position occurs when the revenue from tuition, grant and other sources is less than a Faculty’s direct costs, University Fund contribution and Shared Service allocation. Faculty deficits are typically balanced through a combination of budget targets and subventions. Subventions were determined by the acting Vice-President: Academic in consultation with each Faculty.
For 2018/19, Faculty subventions and surplus returned are as follows:
| Faculty | Subvention 97.7% |
Initial Surplus |
Surplus Returned (15%) |
|---|---|---|---|
| Arts | 6,924,414 | – | – |
| Lazaridis | – | -6,140,016 | 921,002 |
| Education | – | -164,833 | 24,725 |
| HSS | – | -1,744,167 | 261,625 |
| Liberal Arts | 1,971,488 | – | – |
| Music | 5,841,151 | – | – |
| SIPG | 2,116,987 | – | – |
| Science | – | -5,568,699 | 835,305 |
| Social Work | 3,457,102 | – | – |
| Total | 20,311,141 | -13,617,715 | 2,042,657 |
| Less: Targets | – | – | -471,970 |
| RCM Transition | 20,311,141 | -13,617,715 | 1,570,687 |
The University Fund (UF) summarizes at a high level the institutional budgetary position after all Faculty subventions and surpluses have been calculated. The balance of the University Fund is reflected in Table 6 as the institutional surplus/(deficit).
Inflows:
Outflows:
Buget surplus/(deficit): ($0.49) (Note: inflows total minus outflows total).
The largest inflow into the UF is the University Fund Contribution of 8% of the Faculty tuition and grant revenue. The un-attributable revenue is made up of revenue that is not directly attributable to one area, such as interest revenue. The $13.6 million is the full surplus total from the Faculties that is initially returned to the UF.
Institutional costs are funded through the UF and include contingency, debt service and other costs with central oversight. The strategic funds fund the departmental requests, as detailed in Section 3.2.2 Departmental Requests. The remaining outflows from the UF are the returned surplus (15% in 2018/19) to the four Faculties with a positive bottom line position and the subvention funds for those Faculties with a negative bottom line position. Together, the subvention funding and targets bring those Faculties to a balanced position for 2018/19.